Abstract
In Dilla area, vegetables like cabbage can be grown in a variety of methods and are eaten in large quantities. Of the several green leafy vegetables that are acceptable for eating by humans, some are only found in a certain area, while others are found all over the world. The latter category, which includes the Brassica family, includes cabbage. The aim of this study was to use the technique known as flame atomic absorption spectrometry to investigate the levels of specific harmful heavy metals (Cr, Zn, Ni, Cd, and Pb) that are detected in the vegetables. To remove the metals from the samples, the most effective wet digestion technique was used. Heavy metal buildup in the body can result in a number of health risks. Therefore, accurate identification of these pollutants is necessary to ensure safety. Zn and Ni were discovered for the kinds of cabbage examined, according to the analytical results from this study. Zn (47 to 114 mg/kg), Ni (28.6 to 39.7 mg/kg), Cr, Pb, and Cd are below the detection limit, and other metal concentrations (mg/kg) were discovered in the edible sections of cabbage. The level of Zn in cabbage from Andida farm was found to be higher and nickel is lower than the permissible value recommended by FAO/WHO. The values of the analysis of variance (ANOVA) indicated that there was no significant difference (p > 0.05) in the mean values of Zn and Ni between Andida, Darra, Oddo Miqee, and Guangua cabbage samples. The samples in Ni and Zn exhibited the highest correlation coefficient (r = 0.76) in the study's sample correlation coefficient matrices. Thus, it is crucial to regularly check vegetables in order to avoid an excessive accumulation of harmful heavy metals in meals.
Keywords
Brassica Family, Bioaccumulation, Cabbage, Wet Digestion, Heavy Metals
1. Introduction
Originating in the eastern Mediterranean and Anatolia, kale was farmed for food starting at least in 2000 BC. In the fourth century BC, flat-leaved and curly-leaved cabbage cultivars were already known in Greece. These varieties are thought to be the progenitors of contemporary kale; the Romans called them Sabellian kale
| [1] | Ahmet Balkaya & RuhsarYanmaz, “Promising kale (Brassica oleracea var. acephala) populations from Black Sea region, Turkey,” New Zeal. J. Crop Hortic. Sci. ISSN, vol. 0671, 2010, https://doi.org/10.1080/01140671.2005.9514324 |
[1]
. This plant is referred to as Gomen domestically in Ethiopia. Omega-3 and 6 fatty acids are among the important fatty acids that kale is recognized as a great source of. These fatty acids are necessary for healthy development, growth, and survival
| [2] | A. Lord and P. et. al. Thu Huong, “Chemical composition of kale as influenced by dry vermicast, potassium humate and volcanic minerals,” Food Res. Int., vol. 107, pp. 726–737, 2018, https://doi.org/10.1016/j.foodres.2018.03.010 |
[2]
. Herbaceous plants that may be consumed as the primary meal or as a supporting one are collectively referred to as vegetables
| [3] | S Sarkiyayi and F M Samaila, “Determination of heavy metals in some selected vegetables cultivated in Sabon Tasha Yola, Adamawa State,” Direct Res. J. Agric. Food Sci., vol. 5, no. 12, pp. 427–432, 2017, https://doi.org/10.26765/DRJAFS.2017.2079 |
[3]
. Vegetables are important parts of a person's diet since they provide proteins, carbs, vitamins, minerals, and trace elements
| [4] | Girmaye Benti, “Assessment of heavy metals in vegetables irrigated with Awash River in selected farms around Adama town, Ethiopia,” African J. Enviromental Sci. Technol., vol. 8, no. 7, pp. 428–434, 2014, https://doi.org/10.5897/AJEST2014.1732 |
[4]
. Vegetables are an essential component of human nutrition, whether they are cooked or raw, since they are low in fat and carbohydrates and high in vitamins, minerals, and fiber
| [5] | Surukite O. Oluwole et. al., “Determination of Heavy Metal Contaminants in Leafy Vegetables Cultivated By the Road Side,” Int. J. Eng. Res. Dev., vol. 7, no. 3, pp. 1–5, 2013. |
[5]
. Governments generally encourage the eating of vegetables, with a common recommendation of five or more servings per day. Eating veggies is a quick and inexpensive way to receive enough vitamins, minerals, and fiber
| [3] | S Sarkiyayi and F M Samaila, “Determination of heavy metals in some selected vegetables cultivated in Sabon Tasha Yola, Adamawa State,” Direct Res. J. Agric. Food Sci., vol. 5, no. 12, pp. 427–432, 2017, https://doi.org/10.26765/DRJAFS.2017.2079 |
[3]
. When compared to starchy foods, leafy greens are not significant providers of carbohydrates. According to scientific research, eating plenty of vegetables helps prevent cancers of the esophagus, stomach, pancreas, bladder, and cervical regions. A diet rich in vegetables can also prevent 20% of all cancers. Consuming veggies on a daily basis might reduce the risk of numerous illnesses and help the body turn fats and carbs into energy. According to Getachew Alamnie, the use of wastewater for irrigation has led to a rise in the amount of heavy metals contaminating the edible portions of vegetables, which is dangerous for human health
| [6] | Getachew Alamnie et. al., “Heavy Metal Contamination in Green Leafy Vegetables Irrigated with Wastewater Collected from Harar Town Vegetable Farm, Ethiopia,” Food Sci. Qual. Manag., vol. 94, pp. 24–28, 2020, https://doi.org/10.7176/FSQM/94-03 |
[6]
. According to Hamid Shirkhanloo, perishable vegetables are frequently grown in urban locations, which are more likely to be contaminated with heavy metals due to a range of industrial and urban activities
| [7] | Hamid Shirkhanloo et. al., “The evaluation and determination of heavy metals pollution in edible vegetables, water and soil in the south of Tehran province by GIS,” Arch. Environ. Prot., vol. 41, no. 2, pp. 64–74, 2015, https://doi.org/10.1515/aep-2015-0020 |
[7]
. Heavy metals are absorbed by plants through contaminated soil
| [8] | Rahman M Azizur et. al., “Ecotoxicology and Environmental Safety Heavy metals in Australian grown and imported rice and vegetables on sale in Australia : Health hazard,” Ecotoxicol. Environ. Saf., vol. 100, pp. 53–60, 2014, https://doi.org/10.1016/j.ecoenv.2013.11.024 |
[8]
. Toxic levels for a few heavy metals are frequently only above the background quantities that are normally present in the environment. In order to prevent excessive exposure, it is critical that we understand heavy metals
| [3] | S Sarkiyayi and F M Samaila, “Determination of heavy metals in some selected vegetables cultivated in Sabon Tasha Yola, Adamawa State,” Direct Res. J. Agric. Food Sci., vol. 5, no. 12, pp. 427–432, 2017, https://doi.org/10.26765/DRJAFS.2017.2079 |
[3]
.
2. Materials and Methods
2.1. Equipments and Apparatus
In this study, leaf samples were dried using plastic film. Dried vegetable samples were ground and homogenized according to type using a ceramic mortar and pestle. Ground sample powder was sieved using sieves, and the dried and sieved samples were packed in transparent plastic bottles. The materials were dried and weighed using a dry heat oven (Griffin and George Ltd, Britain) and a digital analytical balance (22 ADAM, PW254, 250g). Samples of leaves were broken down and digested using the Kjeldhal equipment.
2.2. Instrument
The selected metals from the kale samples were identified using atomic absorption spectrophotometry (model ZEEnit 700P, Germany) equipped with a hollow cathode lamp for each metal and a deuterium background.
2.3. Reagents and Chemicals
Every chemical employed in this investigation was of the highest analytical purity. In order to digest the materials, for example, 69% HNO3 and 70% HClO4 were utilized. The fabrication of standard samples and experimental spiking tests both employed a 1000 mg/L stock standard solution of (Zn, Ni, and Cd, Cr, Pb) metals. The equipment used for analysis has been rinsed, samples have been diluted, and double-distilled water has been utilized.
2.4. Description of the Study Areas
The study locations were Guangua, Andida, Oddo Miqee, and Darra, which are found in the four corner part of Dilla City. They were chosen purposely because the areas are known for producing large amounts of vegetables.
2.5. Study Design and Sample Collections
From March 2023 to the month of October 2023, a laboratory-based survey was carried out to determine the concentration of heavy metals in a selection of leafy vegetables on the Ethiopian cabbage (Brassica Carinata) that is grown in the vicinity of Dilla. For the purpose of determining the levels of heavy metals, about 1 kilogram of the edible parts (leaves) of these plants was processed. The quantities of heavy metals such as zinc (Zn), nickel (Ni), cadmium (Cd), chromium (Cr), and lead (Pb) were measured in the vegetable samples using flame atomic absorption spectrophotometry. Samples of vegetables were collected using a sampling method. All samples were collected randomly from each site in March 2023 and transported to Dilla University, Food Engineering Department laboratory, for heavy metal analysis.
2.6. Preparation of Sample Vegetables
Every sample was gathered, sealed in plastic bags, and sent to the lab for processing. To get rid of adsorbed dust and other particulates, the obtained samples were first cleaned with tap water and then again with distilled water. To help with drying, the leaves were broken off from the stem with bare hands and sliced into tiny pieces using scissors. To remove moisture and maintain consistent mass, the samples were first dried by air for five to six days and then dried again for 24 hours at 80 to 120 degrees Celsius in a hot air oven. To allow the sample to drop to room temperature, the oven was shut off at the conclusion of the drying process and left overnight. Using a mortar and pestle, the dry samples were crushed into a powder and then sieved through a 300-micron mesh sieve. The material that had been sieved was maintained in plastic bottles until the digesting process was complete.
2.7. Wet Digestion
As part of wet digestion procedures for elemental analysis, sample matrices are broken down chemically in solution. This is usually done with a mix of acids to make the samples more soluble. In order to reduce sample contamination from airborne contaminants, the surrounding environment, and vessel walls, the different acid and flux treatments are performed at high temperatures in specially made containers. Adsorption onto the vessel walls, volatilization, and co-extraction can all result in sample losses, although these can be minimized by changing the procedure. It may be possible to lessen contamination and sample loss by using closed systems, in which the digesting reaction is totally isolated from the environment
| [9] | H. Liu, S. Chen, C. Li, T. Li, Y. Wu, and Y. Liu, “Sequence Determination of Cd and Pb in Honey by Incomplete Digestion-High Resolution Continuum Source Graphite Furnace Atomic Absorption Spectrometry,” vol. 512, pp. 22–27, 2014, https://doi.org/10.4028/www.scientific.net/AMM.511-512.22 |
[9]
.
2.8. Optimization of Digestion Procedures
Prior to doing any experiments, the best working method should be identified. Using the Kjeldhal apparatus and the wet acid digestion method, the optimization approach in this work aimed to find the smallest reagent volume, lowest temperature, and shortest time required to fully degrade the leaf samples. It is expected that organic components would break down into various gaseous forms, such as CO2, NO2, and H2O. The measurement of the total breakdown involved the visualization of colorless and transparent liquids. Each leaf sample weighed 0.25 g of powdered material, which was then put into a 250 mL round-bottom flask. Various quantities of 69% nitric acid and 70% perchloric acid were added in the prescribed amounts, and the samples were then submitted to digestion at various temperatures and times.
2.9. Digestion of Vegetable Samples
Vegetable samples that had been homogenized and powdered weighed 0.25 g and were put into a 250 ml round-bottom flask together with 4 ml of HNO3-HClO4 (3:1, v/v). During 3:30 hours, the mixture was digested using a Kjeldhal device that was heated to 270°C. Following the end of the digestion process, the sample was allowed to cool at room temperature. Clear solutions were then filtered using Whatmann filter paper to remove any remaining material and put into a 50 mL volumetric flask. Following a double-distilled water washing, each digestive flask was fed to the volumetric flask until it reached the desired level of fill. To increase the accuracy of the outcome, each vegetable sample was broken down and examined three times. Three milliliters of HNO3 and one milliliter of HClO4 were combined, and the mixture was treated in the same way as the samples to create the blank solution. Following that, flame atomic absorption spectrophotometry was used to examine the heavy metals.
2.10. Determination of Metals in Kale Leaf Samples
Using the atomic absorption spectroscopy standard, calibration metal standard solutions were created for each metal using an intermediate standard solution containing 10 mg/L. The metal concentrations (Zn, Ni, Cd, Cr, and Pb) in the 1000 mg/L stock solutions were determined using an FAAS equipped with a standard air acetylene flame and a deuterium background corrector. As appropriate, a hollow cathode lamp served as the main source line. In tandem with the kale samples, the same methodology was used to determine the metal content of the digested blank solution while maintaining the same settings. The metal concentrations were all stated in milligrams per kilogram of dry weight.
2.10.1. Limit of Detection and Quantification
The lowest amount recorded in a sample that may be detected with probability is known as the limit of detection (LOD); this value is not always perfect. It can be calculated in this way: LOD is equal to three times the standard deviation of the blank solutions, or 3x SD blank. Lower LOD values suggest that the approach is capable of detecting traces of metals of interest in the sample. The lowest quantity of analyte that, under specified experimental circumstances, may be quantified with reasonable precision and accuracy is known as the limit of quantification, or LOQ. It is computed as follows: LOQ = 10 x SD blank, which is ten times the blank solution's standard deviation.
2.10.2. Method Validation
The process of verifying that the analytical technique used for a particular test is appropriate for its intended use is known as method validation. Analytical data can be evaluated for quality, consistency, and dependability using the results of method validation. Using spiking experiments, the optimized procedure's validity was evaluated. This was accomplished by adding 140 μL of Zn and 355 μL of Ni to 0.25 g of kale samples. A standard solution of 1000 mg/L was utilized, and an intermediate standard solution containing 10 mg/L was created. The validated procedure was used to digest and analyze both the spiked and unspiked samples under identical conditions.
2.10.3. Precision
Precision is the level of consistency between distinct outcomes. Separate identical samples should undergo the entire process several times. The findings from the mean values and standard deviation should be used to gauge it. Precision is expressed as the relative standard deviation using the formula mentioned below.
(1)
2.10.4. Accuracy
Accuracy is the degree to which test results agree with the true value, or how closely the procedure's results match the true value. It is measured by the recovery test of Zn and Ni spiked to the sample. Accuracy is calculated as percent recovery using the formula mentioned below.
(2)
3. Results and Discussion
3.1. Comparision of Heavy Metals in Kale Samples Collected from Four Different Areas
The sensitivity of the heavy metal detection device, the possibility of sample contamination, the possibility of interference from other chemicals when determining the levels of specific heavy metals, the use of precise digestion methodology, and other influencing factors can all result in different values from the same sample that is tested in laboratories. Therefore, every effort was made to ensure that the data presented in this paper was reliable. Flame atomic absorption spectrophotometry was used to determine the concentrations of five different metals; the findings are reported in mg/L and converted to mg/kg.
Table 1. Mean Concentration ± standard deviations in (mg/kg) of metals in kale samples.
| Andida | Darra | Oddo Miqee | Guangua |
Metal | Mean ± SD | RSD (%) | Mean ± SD | RSD (%) | Mean ± SD | RSD (%) | Mean ±SD | RSD (%) |
Zn | 114 ± 10.7 | 9.4 | 47 ± 4.0 | 8.5 | 49.6 ± 2.6 | 5.3 | 69.5 ± 3.7 | 5.3 |
Ni | 35.4 ± 1.4 | 3.8 | 36.4 ± 2.3 | 6.4 | 39.7 ± 0.9 | 2.3 | 28.6 ± 1.1 | 3.7 |
Cd | BDL | - | BDL | - | BDL | - | BDL | - |
Cr | BDL | - | BDL | - | BDL | - | BDL | - |
Pb | BDL | - | BDL | - | BDL | - | BDL | - |
BDL – below detection limit
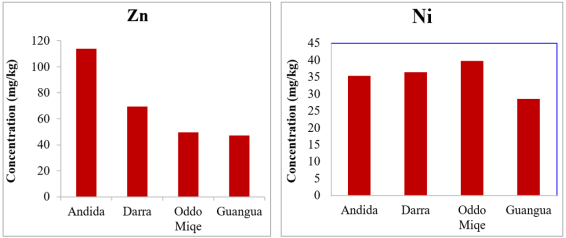
Figure 1. Bar graphs of mean concentration of metals (mg/kg) in four different sample sites.
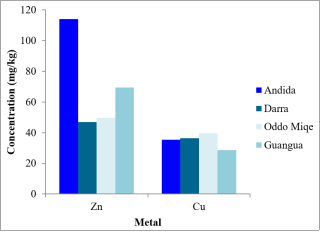
Figure 2. Comparison of Zinc and Nickel content in kale samples from four different areas.
Zinc
Every living thing builds up a significant amount of zinc in their bodies without suffering any negative consequences. Protein synthesis, inter nodal elongation (stem growth), and glucose metabolism all depend on it. Zinc is involved in all of the main metabolic processes and has several functions in the reproduction of genetic material, which leads to cell division. Clinical symptoms and biochemical abnormalities associated with zinc mal-absorption arise when the amount of dietary zinc available to support these processes is inadequate.
Similar symptoms to zinc deficiency are caused by iron deficiency. Immunological issues, growth retardation, and appetite loss are the outcomes of zinc deficiency. According to recent studies, men require more zinc than women do. Therefore; it makes sense that the RDA for zinc is sex-specific. When exposures to zinc beyond physiological requirements, it can become hazardous. Zinc pollutes the environment and can be detected in a variety of foods, soil, and pharmaceutical samples. Significant concentrations of zinc may reduce the soil microbial activity and also are common contaminants in agricultural and food wastes
| [10] | W. Wubishet Gezahegn et. al., “Study of Heavy Metals Accumulation in Leafy Vegetables of Ethiopia,” IOSR J. Environ. Sci. Toxicol. Food Technol., vol. 11, no. 05, pp. 57–68, 2017, https://doi.org/10.9790/2402-1105015768 |
[10]
.
Both the requirement and toxicity of trace metals make them significant. By binding to substrates and favoring different reactions, such as the mediation of oxidation reduction reactions, or redox reactions, through reversible changes in the oxidation state of the metal ions, zinc, an essential functional and structural element in biological systems, frequently catalyzes reactions. According to the World Health Organization, zinc, also known as a micronutrient, has set permissible amounts for a sufficient dietary consumption (WHO). Adults should take between 5.0 and 22.0 mg.
At high concentrations, Zn causes nephritis, anuria and extensive lesions in the kidneys
| [11] | Seyed Vali Hosseini et. al., “Determination of toxic (Pb, Cd) and essential (Zn, Mn) metals in canned tuna fish produced in Iran,” J. Environ. Heal. Sci. Eng., pp. 15–20, 2015, https://doi.org/10.1186/s40201-015-0215-x |
[11]
. In the present investigation, the values of Zn range from 47 to 114 mg/kg in various kale samples. The maximum concentration (114 mg/kg) of zinc was recorded in samples collected from Andida, while minimum concentration (47 mg/kg) was obtained from Darra.
Nickel
Oddo Miqee had the greatest nickel concentration (39.7 mg/kg), while Guangua had the lowest (28.6 mg/kg), both of which were below the FAO/WHO-recommended acceptable limit
| [12] | FAO/WHO, “Evaluation of certain food additives,” FAO/WHO, Geneva, Switzerland, 2012. |
[12]
. The degree of contamination in the areas under study may be the cause of the discrepancy between the current results and the data published by
| [13] | Amare Hailu, “Metal Concentration in Vegetables Grown in Northern Addis Ababa and Part of Rift Valley (Ziway), Ethiopia,” 2007. |
[13]
and
| [10] | W. Wubishet Gezahegn et. al., “Study of Heavy Metals Accumulation in Leafy Vegetables of Ethiopia,” IOSR J. Environ. Sci. Toxicol. Food Technol., vol. 11, no. 05, pp. 57–68, 2017, https://doi.org/10.9790/2402-1105015768 |
[10]
.
3.2. Comparison of Metal Concentration in Kale Samples with Other Literature Values
Comparison of metal concentration in kale samples with other literature values is summarized in
table 2.
Table 2. Comparison of metal concentration in kale samples with other literature values.
Sample | Mean Concentration (mg/kg) | Method | Country | Reference |
Zn Ni Cd Cr Pb |
Ethiopian kale | 52.8 | 1.0 | NR | 2.7 | 2.8 | EDXRF | India | | [10] | W. Wubishet Gezahegn et. al., “Study of Heavy Metals Accumulation in Leafy Vegetables of Ethiopia,” IOSR J. Environ. Sci. Toxicol. Food Technol., vol. 11, no. 05, pp. 57–68, 2017, https://doi.org/10.9790/2402-1105015768 |
[10] |
Ethiopian kale | 99.8 | NR | 0.2 | 0.3 | 0.7 | GFAAS | Ethiopia | | [14] | MELAKU GIZAW, “Bioaccumulation and Toxicological Implication of Heavy Metals in Fish, and Vegetables Irrigated With Akaki River, Addis Ababa, Ethiopia,” 2018. |
[14] |
Ethiopian kale | 88.3 | 11.1 | 6.3 | 13.3 | 7.2 | FAAS | Ethiopia | | [15] | Banchamlak Tegegne et. al., “Determination of the Level of Metallic Contamination in Irrigation Vegetables, the Soil, and the Water in Gondar City, Ethiopia,” Nutr. Diet. Suppl., vol. Volume 13, pp. 1–7, 2021, https://doi.org/10.2147/nds.s283451 |
[15] |
Ethiopian kale | 63.7 | 4.6 | 0.1 | 0.9 | 0.5 | FAAS | Ethiopia | | [13] | Amare Hailu, “Metal Concentration in Vegetables Grown in Northern Addis Ababa and Part of Rift Valley (Ziway), Ethiopia,” 2007. |
[13] |
Kale from Andida | 114 | 35.4 | BDL | BDL | BDL | FAAS | Ethiopia | This study |
Kale from Darra | 47 | 36.4 | BDL | BDL | BDL | FAAS | Ethiopia | This study |
Kale from Oddo Miqe | 49.6 | 39.7 | BDL | BDL | BDL | FAAS | Ethiopia | This study |
Kale from Guangua | 69.5 | 28.6 | BDL | BDL | BDL | FAAS | Ethiopia | This study |
NR- not reported
Table 2 indicates mean concentrations of this study compared with research done by
| [10] | W. Wubishet Gezahegn et. al., “Study of Heavy Metals Accumulation in Leafy Vegetables of Ethiopia,” IOSR J. Environ. Sci. Toxicol. Food Technol., vol. 11, no. 05, pp. 57–68, 2017, https://doi.org/10.9790/2402-1105015768 |
| [13] | Amare Hailu, “Metal Concentration in Vegetables Grown in Northern Addis Ababa and Part of Rift Valley (Ziway), Ethiopia,” 2007. |
| [14] | MELAKU GIZAW, “Bioaccumulation and Toxicological Implication of Heavy Metals in Fish, and Vegetables Irrigated With Akaki River, Addis Ababa, Ethiopia,” 2018. |
| [15] | Banchamlak Tegegne et. al., “Determination of the Level of Metallic Contamination in Irrigation Vegetables, the Soil, and the Water in Gondar City, Ethiopia,” Nutr. Diet. Suppl., vol. Volume 13, pp. 1–7, 2021, https://doi.org/10.2147/nds.s283451 |
[10, 13-15]
. From this data the variation between mean concentration of metals in this study and literature values is highlighted.
The mean concentration of Zn in the samples from the different sites in this study 114, 47, 49.6, 69.5 mg/kg for kale samples is somewhat in a good agreement with that reported by the values reported
| [13] | Amare Hailu, “Metal Concentration in Vegetables Grown in Northern Addis Ababa and Part of Rift Valley (Ziway), Ethiopia,” 2007. |
[13]
and
| [10] | W. Wubishet Gezahegn et. al., “Study of Heavy Metals Accumulation in Leafy Vegetables of Ethiopia,” IOSR J. Environ. Sci. Toxicol. Food Technol., vol. 11, no. 05, pp. 57–68, 2017, https://doi.org/10.9790/2402-1105015768 |
[10]
. The study done by
| [13] | Amare Hailu, “Metal Concentration in Vegetables Grown in Northern Addis Ababa and Part of Rift Valley (Ziway), Ethiopia,” 2007. |
[13]
indicates 63.7 and 35.08 mg/kg of kale from Kera and Akaki farms and a study done by
| [10] | W. Wubishet Gezahegn et. al., “Study of Heavy Metals Accumulation in Leafy Vegetables of Ethiopia,” IOSR J. Environ. Sci. Toxicol. Food Technol., vol. 11, no. 05, pp. 57–68, 2017, https://doi.org/10.9790/2402-1105015768 |
[10]
indicates 52.8 and 10.9 mg/kg of kale from Akaki and Debre Birhan.
For Nickel
table 2 indicates concentration of 35.4, 36.4, 39.7, 28.6 mg/kg for kale samples and it is in a good agreement with that reported by the researchers
| [15] | Banchamlak Tegegne et. al., “Determination of the Level of Metallic Contamination in Irrigation Vegetables, the Soil, and the Water in Gondar City, Ethiopia,” Nutr. Diet. Suppl., vol. Volume 13, pp. 1–7, 2021, https://doi.org/10.2147/nds.s283451 |
[15]
and
| [13] | Amare Hailu, “Metal Concentration in Vegetables Grown in Northern Addis Ababa and Part of Rift Valley (Ziway), Ethiopia,” 2007. |
[13]
.
In
Table 2 Cd, Cr and Pb are found below detection limit. But according to the study done by
| [15] | Banchamlak Tegegne et. al., “Determination of the Level of Metallic Contamination in Irrigation Vegetables, the Soil, and the Water in Gondar City, Ethiopia,” Nutr. Diet. Suppl., vol. Volume 13, pp. 1–7, 2021, https://doi.org/10.2147/nds.s283451 |
| [13] | Amare Hailu, “Metal Concentration in Vegetables Grown in Northern Addis Ababa and Part of Rift Valley (Ziway), Ethiopia,” 2007. |
| [10] | W. Wubishet Gezahegn et. al., “Study of Heavy Metals Accumulation in Leafy Vegetables of Ethiopia,” IOSR J. Environ. Sci. Toxicol. Food Technol., vol. 11, no. 05, pp. 57–68, 2017, https://doi.org/10.9790/2402-1105015768 |
[15, 13, 10]
, Cd, Cr, and Pb were detected and reported.
3.3. Comparisons for Metal Concentration of Kale with Other Leafy Vegetables
Table 3 summarizes the levels of metal concentration in the vegetables (Ethiopian Kale) and compares them to other edible plants reported worldwide. The comparison shows that the current study's findings are consistent with the majority of the published values.
Table 3. Comparison of metal concentrations in kale with other leafy vegetables reported in the literature from Ethiopia.
Sample | Metal Concentration (mg/kg) | Reference |
Zn Ni Cd Cr Pb |
Cabbage | 27.8 | 7.4 | 1.6 | 10 | 3.8 | | [15] | Banchamlak Tegegne et. al., “Determination of the Level of Metallic Contamination in Irrigation Vegetables, the Soil, and the Water in Gondar City, Ethiopia,” Nutr. Diet. Suppl., vol. Volume 13, pp. 1–7, 2021, https://doi.org/10.2147/nds.s283451 |
[15] |
43.2 | 1.0 | NR | 2.2 | 12.3 | | [10] | W. Wubishet Gezahegn et. al., “Study of Heavy Metals Accumulation in Leafy Vegetables of Ethiopia,” IOSR J. Environ. Sci. Toxicol. Food Technol., vol. 11, no. 05, pp. 57–68, 2017, https://doi.org/10.9790/2402-1105015768 |
[10] |
Swiss chard | 106.1 | NR | 0.37 | 0.45 | 1.06 | | [14] | MELAKU GIZAW, “Bioaccumulation and Toxicological Implication of Heavy Metals in Fish, and Vegetables Irrigated With Akaki River, Addis Ababa, Ethiopia,” 2018. |
[14] |
48.6 | 51.8 | 1.4 | 11.6 | 9.5 | | [15] | Banchamlak Tegegne et. al., “Determination of the Level of Metallic Contamination in Irrigation Vegetables, the Soil, and the Water in Gondar City, Ethiopia,” Nutr. Diet. Suppl., vol. Volume 13, pp. 1–7, 2021, https://doi.org/10.2147/nds.s283451 |
[15] |
Lettuce | 111.2 | NR | 0.39 | 0.45 | 1.43 | | [14] | MELAKU GIZAW, “Bioaccumulation and Toxicological Implication of Heavy Metals in Fish, and Vegetables Irrigated With Akaki River, Addis Ababa, Ethiopia,” 2018. |
[14] |
64.5 | 48.14 | 0.23 | 6.6 | 2.38 | | [15] | Banchamlak Tegegne et. al., “Determination of the Level of Metallic Contamination in Irrigation Vegetables, the Soil, and the Water in Gondar City, Ethiopia,” Nutr. Diet. Suppl., vol. Volume 13, pp. 1–7, 2021, https://doi.org/10.2147/nds.s283451 |
[15] |
Kale from Andida | 114 | 35.4 | BDL | BDL | BDL | This study |
Kale from Darra | 47 | 36.4 | BDL | BDL | BDL | This study |
Kale from Oddo Miqe | 49.6 | 39.7 | BDL | BDL | BDL | This study |
Kale from Guangua | 69.5 | 28.6 | BDL | BDL | BDL | This study |
3.4. Comparison of Results of the Present Study with WHO/FAO Joint CODEX Maximum Permissible Levels
Table 4. Comparison of results of the present study with WHO/FAO Values.
Parameters | Metals (mg/kg) |
Zn | Ni | Cd | Cr | Pb |
WHO/FAO Values | 99.4 | 66.9 | 0.2 | 2.3 | 0.3 |
Kale samples | Andida | 114 | 35.4 | - | - | - |
Darra | 47 | 36.4 | - | - | - |
Oddo Miqee | 49.6 | 39.7 | - | - | - |
Guangua | 69.5 | 28.6 | - | - | - |
Table 4 presents the comparisons between the results in the present study with WHO/FAO reported at 2012. It was discovered that the amount of zinc in the kale from Andida farm was higher than the FAO/WHO-recommended allowable value, whereas the amount of nickel was lower
| [12] | FAO/WHO, “Evaluation of certain food additives,” FAO/WHO, Geneva, Switzerland, 2012. |
[12]
. The daily average diet per person per day of leafy vegetables is 50 g.
3.5. Statistical Analysis
The organizing and interpretation of data in accordance with precise, methodical, and quantitative processes and guidelines is the focus of statistical analysis. Numbers are used to represent data in statistical analysis.
In this study, a sample of kale leaves was collected randomly from four different places. Several random errors may be introduced in each replicate measurement during this process. As a result, depending on the type and nature of the results, the statistical method is used to determine whether or not these random errors contribute to the difference in analysis results. If there is a difference in the statistical analysis, it indicates whether the differences are significant or not at a specified constant level.
To determine if there are significant differences between the means of each plant sample, the statistical analysis is conducted using one-way analysis of variance (ANOVA) with the kale samples as an independent variable and the metal content as an independent variable. Microsoft Excel was used to compare the statistical parameters, and the result of the analysis is indicated in
Table 5.
Table 5. ANOVA between and within kale samples at 95% confidence level
Metals | Fcal | Fcrit | P-value | Remark |
Zn | 3.8365 | 5.0503 | 0.2063 | No significance difference between sample means |
Ni | 3.1798 | 5.0503 | 0.1171 | No significance difference between sample means |
Fcal = Fcalculated, Fcrit = Fcritical
The values of the analysis of variance (ANOVA) shown on
Table 5 indicated that there was no significance difference (p > 0.05) in the mean values of Zn and Ni between Andida, Darra, Oddo Miqee, and Guangua cabbage samples.
3.6. The Correlation Coefficient of Metals
A statistical metric used to determine the degree of a linear relationship between two variables is the correlation coefficient. The range of values is -1 to 1. Perfect negative correlation was indicated by a correlation coefficient of -1, whilst perfect positive correlation was shown by a correlation coefficient of 1. There is no relationship between the two variables' movements when the correlation is zero. The highest correlation coefficient (r = 0.76) was found in the sample correlation coefficient matrices for the samples shown in
Table 6 for Ni and Zinc.
Table 6. Pearson correlation coefficients between metal concentrations in kale samples.
| Zn | Ni | Cd | Cr | Pb |
Zn | 1 | - | - | - | - |
Ni | 0.76 | 1 | - | - | - |
4. Conclusion
In this study the levels of selected heavy metals in kale leaves collected from four different areas around Dilla city were analyzed for their contents of Zn, Ni, Cd, Cr and Pb using flame atomic absorption spectrometry. By adding known concentration standards to the solid sample, the recovery experiment assessed the best wet digestion technique for kale samples, yielding a good percentage recovery (92.3% for Zn and 110% for Ni). The edible portions of the kale contained the following metal values (mg kg-1): Ni (28.6 mg/kg to 39.7 mg/kg) and Zn (47 to 114 mg/kg). Cr, Pb, and Cd are below the limit of detection. Vegetables grown in Andida had the greatest concentration of heavy metals. The study indicated that while Ni is not above the maximum allowable levels, the concentrations of Zn in the veggies were found to be above the safe limits established by WHO/FAO for eating and to pose a major health concern to humans. The mean Zn and Ni values for the Guangua, Andida, Darra, and Oddo Miqee kale samples did not differ significantly (p > 0.05), according to statistical analysis performed using one way analysis of variance (ANOVA). The samples in Ni and Zinc exhibited the highest correlation coefficient (r = 0.76) in the study's sample correlation coefficient matrices. Thus, it is crucial to regularly check vegetables in order to avoid an excessive accumulation of harmful heavy metals in meals. As a result, both the degree of heavy metal contamination and the health risk can be decreased.
Abbreviations
ANOVA | Analysis of Variance |
BDL | Below Detection Limit |
FAAS | Flame Atomic Absorption Spectrometry |
FAO | Food and Agriculture Organization |
LOD | Limit of Detection |
LOQ | Limit of Quantification |
NR | Not Reported |
RDA | Recommended Dietary Allowance |
RSD | Relative Standard Deviation |
SD | Standard Deviation |
WHO | World Health Organization |
Acknowledgments
The authors acknowledge Dilla Universities for its generous financial support.
Author Contributions
Ayalew Mekuria: Conceptualization, Data curation, Formal Analysis, Investigation, Methodology, Project administration, Resources, Validation, Visualization, Writing – original draft
Samuel Gemeda: Data curation, Methodology, Project administration, Resources, Supervision, Validation
Elias Ture: Data curation, Methodology, Resources, Visualization, Writing – review & editing
Bilise Getachew: Data curation, Methodology, Supervision, Validation, Writing – review & editing
Conflicts of Interest
The authors declare no conflicts of interest.
References
| [1] |
Ahmet Balkaya & RuhsarYanmaz, “Promising kale (Brassica oleracea var. acephala) populations from Black Sea region, Turkey,” New Zeal. J. Crop Hortic. Sci. ISSN, vol. 0671, 2010,
https://doi.org/10.1080/01140671.2005.9514324
|
| [2] |
A. Lord and P. et. al. Thu Huong, “Chemical composition of kale as influenced by dry vermicast, potassium humate and volcanic minerals,” Food Res. Int., vol. 107, pp. 726–737, 2018,
https://doi.org/10.1016/j.foodres.2018.03.010
|
| [3] |
S Sarkiyayi and F M Samaila, “Determination of heavy metals in some selected vegetables cultivated in Sabon Tasha Yola, Adamawa State,” Direct Res. J. Agric. Food Sci., vol. 5, no. 12, pp. 427–432, 2017,
https://doi.org/10.26765/DRJAFS.2017.2079
|
| [4] |
Girmaye Benti, “Assessment of heavy metals in vegetables irrigated with Awash River in selected farms around Adama town, Ethiopia,” African J. Enviromental Sci. Technol., vol. 8, no. 7, pp. 428–434, 2014,
https://doi.org/10.5897/AJEST2014.1732
|
| [5] |
Surukite O. Oluwole et. al., “Determination of Heavy Metal Contaminants in Leafy Vegetables Cultivated By the Road Side,” Int. J. Eng. Res. Dev., vol. 7, no. 3, pp. 1–5, 2013.
|
| [6] |
Getachew Alamnie et. al., “Heavy Metal Contamination in Green Leafy Vegetables Irrigated with Wastewater Collected from Harar Town Vegetable Farm, Ethiopia,” Food Sci. Qual. Manag., vol. 94, pp. 24–28, 2020,
https://doi.org/10.7176/FSQM/94-03
|
| [7] |
Hamid Shirkhanloo et. al., “The evaluation and determination of heavy metals pollution in edible vegetables, water and soil in the south of Tehran province by GIS,” Arch. Environ. Prot., vol. 41, no. 2, pp. 64–74, 2015,
https://doi.org/10.1515/aep-2015-0020
|
| [8] |
Rahman M Azizur et. al., “Ecotoxicology and Environmental Safety Heavy metals in Australian grown and imported rice and vegetables on sale in Australia : Health hazard,” Ecotoxicol. Environ. Saf., vol. 100, pp. 53–60, 2014,
https://doi.org/10.1016/j.ecoenv.2013.11.024
|
| [9] |
H. Liu, S. Chen, C. Li, T. Li, Y. Wu, and Y. Liu, “Sequence Determination of Cd and Pb in Honey by Incomplete Digestion-High Resolution Continuum Source Graphite Furnace Atomic Absorption Spectrometry,” vol. 512, pp. 22–27, 2014,
https://doi.org/10.4028/www.scientific.net/AMM.511-512.22
|
| [10] |
W. Wubishet Gezahegn et. al., “Study of Heavy Metals Accumulation in Leafy Vegetables of Ethiopia,” IOSR J. Environ. Sci. Toxicol. Food Technol., vol. 11, no. 05, pp. 57–68, 2017,
https://doi.org/10.9790/2402-1105015768
|
| [11] |
Seyed Vali Hosseini et. al., “Determination of toxic (Pb, Cd) and essential (Zn, Mn) metals in canned tuna fish produced in Iran,” J. Environ. Heal. Sci. Eng., pp. 15–20, 2015,
https://doi.org/10.1186/s40201-015-0215-x
|
| [12] |
FAO/WHO, “Evaluation of certain food additives,” FAO/WHO, Geneva, Switzerland, 2012.
|
| [13] |
Amare Hailu, “Metal Concentration in Vegetables Grown in Northern Addis Ababa and Part of Rift Valley (Ziway), Ethiopia,” 2007.
|
| [14] |
MELAKU GIZAW, “Bioaccumulation and Toxicological Implication of Heavy Metals in Fish, and Vegetables Irrigated With Akaki River, Addis Ababa, Ethiopia,” 2018.
|
| [15] |
Banchamlak Tegegne et. al., “Determination of the Level of Metallic Contamination in Irrigation Vegetables, the Soil, and the Water in Gondar City, Ethiopia,” Nutr. Diet. Suppl., vol. Volume 13, pp. 1–7, 2021,
https://doi.org/10.2147/nds.s283451
|
Cite This Article
-
ACS Style
Mekuria, A.; Gemeda, S.; Ture, E.; Getachew, B. Determination of Heavy Metal Contaminants in Leafy Vegetables (Ethiopian Cabbage) Cultivated Around Dilla Town. Frontiers. 2024, 4(4), 142-149. doi: 10.11648/j.frontiers.20240404.14
 Copy
|
Copy
|
 Download
AMA Style
Mekuria A, Gemeda S, Ture E, Getachew B. Determination of Heavy Metal Contaminants in Leafy Vegetables (Ethiopian Cabbage) Cultivated Around Dilla Town. Frontiers. 2024;4(4):142-149. doi: 10.11648/j.frontiers.20240404.14
Copy
|
Download
-
@article{10.11648/j.frontiers.20240404.14,
  author = {Ayalew Mekuria and Samuel Gemeda and Elias Ture and Bilise Getachew},
  title = {Determination of Heavy Metal Contaminants in Leafy Vegetables (Ethiopian Cabbage) Cultivated Around Dilla Town
},
  journal = {Frontiers},
  volume = {4},
  number = {4},
  pages = {142-149},
  doi = {10.11648/j.frontiers.20240404.14},
  url = {https://doi.org/10.11648/j.frontiers.20240404.14},
  eprint = {https://article.sciencepublishinggroup.com/pdf/10.11648.j.frontiers.20240404.14},
  abstract = {In Dilla area, vegetables like cabbage can be grown in a variety of methods and are eaten in large quantities. Of the several green leafy vegetables that are acceptable for eating by humans, some are only found in a certain area, while others are found all over the world. The latter category, which includes the Brassica family, includes cabbage. The aim of this study was to use the technique known as flame atomic absorption spectrometry to investigate the levels of specific harmful heavy metals (Cr, Zn, Ni, Cd, and Pb) that are detected in the vegetables. To remove the metals from the samples, the most effective wet digestion technique was used. Heavy metal buildup in the body can result in a number of health risks. Therefore, accurate identification of these pollutants is necessary to ensure safety. Zn and Ni were discovered for the kinds of cabbage examined, according to the analytical results from this study. Zn (47 to 114 mg/kg), Ni (28.6 to 39.7 mg/kg), Cr, Pb, and Cd are below the detection limit, and other metal concentrations (mg/kg) were discovered in the edible sections of cabbage. The level of Zn in cabbage from Andida farm was found to be higher and nickel is lower than the permissible value recommended by FAO/WHO. The values of the analysis of variance (ANOVA) indicated that there was no significant difference (p > 0.05) in the mean values of Zn and Ni between Andida, Darra, Oddo Miqee, and Guangua cabbage samples. The samples in Ni and Zn exhibited the highest correlation coefficient (r = 0.76) in the study's sample correlation coefficient matrices. Thus, it is crucial to regularly check vegetables in order to avoid an excessive accumulation of harmful heavy metals in meals.
},
 year = {2024}
}
Copy
|
Download
-
TY  - JOUR
T1  - Determination of Heavy Metal Contaminants in Leafy Vegetables (Ethiopian Cabbage) Cultivated Around Dilla Town

AU  - Ayalew Mekuria
AU  - Samuel Gemeda
AU  - Elias Ture
AU  - Bilise Getachew
Y1  - 2024/12/25
PY  - 2024
N1  - https://doi.org/10.11648/j.frontiers.20240404.14
DO  - 10.11648/j.frontiers.20240404.14
T2  - Frontiers
JF  - Frontiers
JO  - Frontiers
SP  - 142
EP  - 149
PB  - Science Publishing Group
SN  - 2994-7197
UR  - https://doi.org/10.11648/j.frontiers.20240404.14
AB  - In Dilla area, vegetables like cabbage can be grown in a variety of methods and are eaten in large quantities. Of the several green leafy vegetables that are acceptable for eating by humans, some are only found in a certain area, while others are found all over the world. The latter category, which includes the Brassica family, includes cabbage. The aim of this study was to use the technique known as flame atomic absorption spectrometry to investigate the levels of specific harmful heavy metals (Cr, Zn, Ni, Cd, and Pb) that are detected in the vegetables. To remove the metals from the samples, the most effective wet digestion technique was used. Heavy metal buildup in the body can result in a number of health risks. Therefore, accurate identification of these pollutants is necessary to ensure safety. Zn and Ni were discovered for the kinds of cabbage examined, according to the analytical results from this study. Zn (47 to 114 mg/kg), Ni (28.6 to 39.7 mg/kg), Cr, Pb, and Cd are below the detection limit, and other metal concentrations (mg/kg) were discovered in the edible sections of cabbage. The level of Zn in cabbage from Andida farm was found to be higher and nickel is lower than the permissible value recommended by FAO/WHO. The values of the analysis of variance (ANOVA) indicated that there was no significant difference (p > 0.05) in the mean values of Zn and Ni between Andida, Darra, Oddo Miqee, and Guangua cabbage samples. The samples in Ni and Zn exhibited the highest correlation coefficient (r = 0.76) in the study's sample correlation coefficient matrices. Thus, it is crucial to regularly check vegetables in order to avoid an excessive accumulation of harmful heavy metals in meals.

VL  - 4
IS  - 4
ER  -
Copy
|
Download